A properly configured WordPress caching stack is the difference between a 3-second page load and a 50-millisecond one. A typical WordPress page fires off 100 to 200 database queries before the visitor sees a single pixel. Every query means a round trip to MySQL, row locks, and wasted CPU cycles. We reduced that number to 5-10 queries on production sites by stacking four caching layers, each one catching what the previous layer misses.
This is the same stack we run on our own infrastructure and deploy for client sites. It is not theoretical. The numbers in this post come from real Nginx access logs, Redis monitoring output, and MySQL slow query analysis on live WordPress installations running on budget VPS hardware.
The four WordPress caching layers work like a series of safety nets. A request comes in and hits the fastest cache first. If that cache has the answer, the response goes back immediately without touching PHP or the database at all. If it misses, the request falls through to the next layer. By the time a query actually reaches the MySQL disk, it represents less than 1% of all traffic.
We will walk through each layer in order, with production-ready configuration files, the gotchas that cost us hours of debugging, and the measured before-and-after results.
Key Takeaways
- 4-layer caching reduces database queries from 100-200 to 0-10 per page load using Nginx FastCGI (page cache) + Redis (object cache) + ProxySQL (query pooling) + InnoDB (buffer pool)
- Nginx FastCGI cache delivers sub-10ms page responses by serving static HTML directly from disk, bypassing PHP, WordPress, and MySQL entirely for cached pages
- Redis object cache eliminates 30-40% of database queries by storing WordPress transients, options, and query results in RAM with sub-millisecond access times
- 95%+ cache hit rates are achievable with proper bypass rules for logged-in users, WooCommerce cart/checkout pages, and POST requests
- Server-level caching outperforms plugin-based caching by 10-50x because plugins still load PHP and WordPress core on every request, while FastCGI cache operates at the web server layer
Bottom line: Nginx FastCGI cache serves pages in 4-5ms compared to 200-400ms for uncached WordPress requests – a 50-100x performance improvement.
Layer 1: Nginx FastCGI Cache for WordPress
Setting up Nginx FastCGI cache for WordPress is the single most impactful optimization you can make. It stores the complete rendered HTML page on disk. When a request comes in for a URL that has been cached, Nginx serves the static file directly without ever touching PHP-FPM, WordPress, or MySQL. The entire application stack is bypassed.
For anonymous visitors (which represent 95-99% of traffic on most sites), this means page responses in under 10 milliseconds. That is not a typo. A page that previously took 500ms to generate through WordPress now comes back faster than a static HTML file served from a CDN, because it is being served from local disk with zero processing overhead.
The Configuration
Add this to your main nginx.conf or in an http block include. This defines the cache zone that all your server blocks will reference:
# /etc/nginx/conf.d/fastcgi-cache.conf
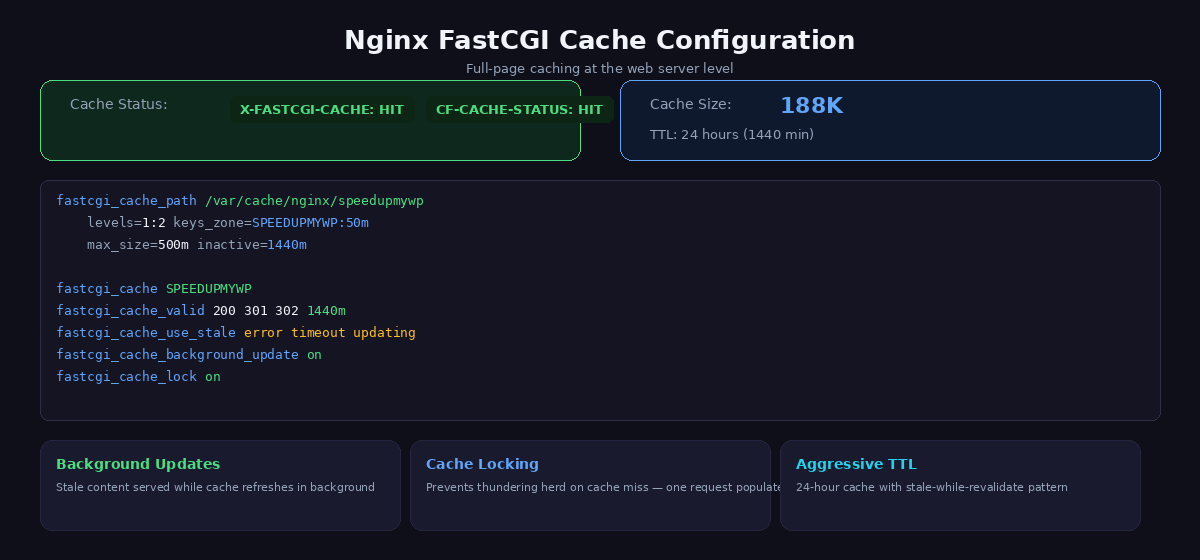
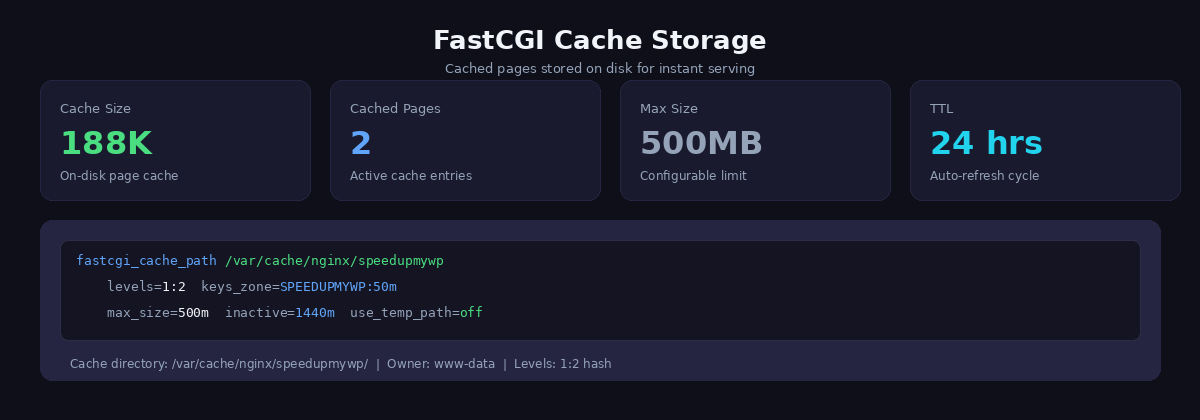
fastcgi_cache_path /var/cache/nginx/wpcache levels=1:2 keys_zone=wpcache:10m inactive=1440m max_size=1g;
fastcgi_cache_key "$scheme$request_method$host$request_uri";
fastcgi_cache_valid 200 301 302 1440m;
fastcgi_cache_use_stale error timeout updating invalid_header http_500 http_503;
fastcgi_cache_lock on;
fastcgi_cache_lock_timeout 5s;The keys_zone=wpcache:10m allocates 10MB of shared memory for cache keys, which is enough for roughly 80,000 cached pages. The inactive=1440m means cached entries expire after 24 hours of not being accessed. The max_size=1g caps total disk usage at 1GB.
Two directives are often overlooked but critically important. fastcgi_cache_use_stale tells Nginx to serve stale cached content if PHP-FPM is down or slow, which keeps your site online during backend failures. fastcgi_cache_lock prevents the thundering herd problem: when a cache entry expires and 50 simultaneous requests come in for that URL, only one request passes through to PHP while the other 49 wait for the fresh cache entry.
Bypass Rules
You must not cache everything. Logged-in users need to see their own admin bar and personalised content. WooCommerce users need their cart state preserved. POST requests must always reach PHP. Here is the bypass logic for your server block:
# Inside your server block
set $skip_cache 0;

# POST requests
if ($request_method = POST) { set $skip_cache 1; }

# URLs with query strings
if ($query_string != "") { set $skip_cache 1; }

# WordPress admin and login
if ($request_uri ~* "/wp-admin/|/wp-login.php|/xmlrpc.php") { set $skip_cache 1; }

# WooCommerce pages
if ($request_uri ~* "/cart/|/checkout/|/my-account/") { set $skip_cache 1; }

# Logged-in users and recent commenters
if ($http_cookie ~* "comment_author|wordpress_[a-f0-9]+|wp-postpass|wordpress_no_cache|wordpress_logged_in|woocommerce_cart_hash|woocommerce_items_in_cart") {
    set $skip_cache 1;
}

location ~ .php$ {
    fastcgi_cache wpcache;
    fastcgi_cache_bypass $skip_cache;
    fastcgi_no_cache $skip_cache;
    add_header X-FastCGI-Cache $upstream_cache_status;
    # ... rest of your PHP-FPM config
}
The X-FastCGI-Cache header is your best debugging tool. Open your browser’s developer tools, check the response headers, and you will see either HIT, MISS, BYPASS, or STALE. If you are seeing MISS on every request, something in your bypass rules is triggering when it should not be. The most common culprit is a plugin setting a wordpress_no_cache cookie on every page load.
Cache Purging
When you publish or update a post, you need to clear the cached version. The simplest approach is a full purge:
sudo rm -rf /var/cache/nginx/wpcache/*
# Nginx does NOT need a reload - it detects missing cache files automatically
For automated purging on content changes, we use a small helper script triggered by a WordPress hook. But manual purging with the command above covers most workflows. After purging, the first visitor to each page triggers a cache rebuild, which brings us to cache warming later in this post.
Key takeaway: Redis object cache reduces database queries by 30-40% and eliminates the autoload bloat problem that plagues high-traffic WordPress sites.
Layer 2: Redis Object Cache
FastCGI cache handles anonymous visitors brilliantly, but it does nothing for logged-in users, admin dashboard pages, or WooCommerce sessions. These requests bypass the page cache entirely and hit PHP-FPM, which means WordPress executes its full bootstrap and fires dozens of database queries. This is where Redis comes in.
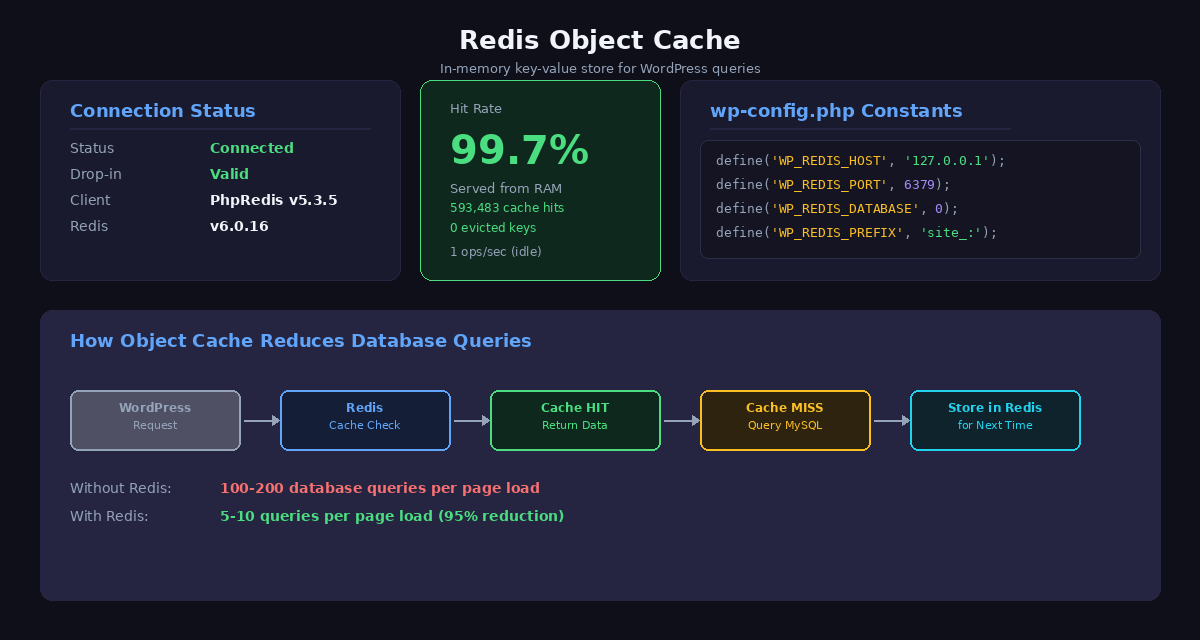
Redis is an in-memory key-value store. The WordPress object cache API (wp_cache_get, wp_cache_set) stores database query results in Redis instead of letting them evaporate at the end of each PHP request. On the next request, WordPress checks Redis first. If the data is there, it skips the MySQL query entirely. For a deeper look at diagnosing and fixing database bloat, see our WordPress database optimization guide.
Installation
# Install Redis server
sudo apt install redis-server

# Verify it is running
redis-cli ping
# Should return: PONG

# Install the Redis object cache drop-in via WP-CLI
cd /var/www/yoursite
sudo -u wpuser wp plugin install redis-cache --activate
sudo -u wpuser wp redis enable
wp-config.php Configuration
Add these constants to your wp-config.php:
/* Redis Object Cache Settings */
define('WP_REDIS_HOST', '127.0.0.1');
define('WP_REDIS_PORT', 6379);
define('WP_REDIS_DATABASE', 0);
define('WP_REDIS_TIMEOUT', 1);
define('WP_REDIS_READ_TIMEOUT', 1);
The ABSPATH Bug: A Common Trap
This is the single most frustrating gotcha with Redis Object Cache, and it has wasted hours of our time on more than one deployment. The Redis constants must be defined before the line that reads require_once ABSPATH . 'wp-settings.php'; in your wp-config.php.
If you place them after that line, WordPress has already loaded the object cache drop-in by the time your constants are defined. Redis will appear to be “enabled” in the WordPress admin panel, but it silently falls back to direct database queries on every single request. Your hit rate will be 0% and you will have no idea why, because there are no errors in the logs.
The correct structure of wp-config.php looks like this:
/* Database settings */
define('DB_NAME', 'wordpress');
define('DB_USER', 'wp_dbuser');
// ... other DB defines ...

/* Redis Object Cache - MUST be before wp-settings.php */
define('WP_REDIS_HOST', '127.0.0.1');
define('WP_REDIS_PORT', 6379);
define('WP_REDIS_DATABASE', 0);
define('WP_REDIS_TIMEOUT', 1);
define('WP_REDIS_READ_TIMEOUT', 1);

/* Absolute path to the WordPress directory */
if ( ! defined('ABSPATH') ) {
    define('ABSPATH', __DIR__ . '/');
}

/** Sets up WordPress vars and included files. */
require_once ABSPATH . 'wp-settings.php';
Verifying Redis Is Working
After enabling, verify with WP-CLI:
sudo -u wpuser wp redis statusYou should see output showing a hit rate above 85%. If the hit rate is below 50% or shows 0 hits, check the ABSPATH ordering issue described above. You can also monitor Redis in real time with redis-cli monitor to watch queries flowing through.
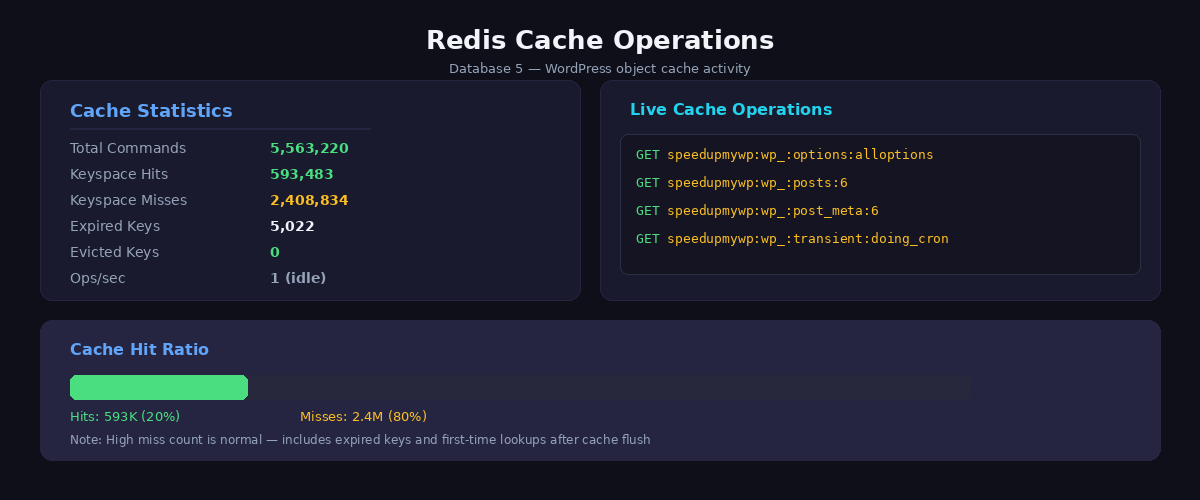
The measurable impact: database query execution time drops from 50-100ms to 1-5ms for logged-in users. The WordPress admin dashboard, which typically runs 200+ queries per page, becomes noticeably snappier. This is especially important if you are running WooCommerce, where every cart and checkout interaction hits the database.
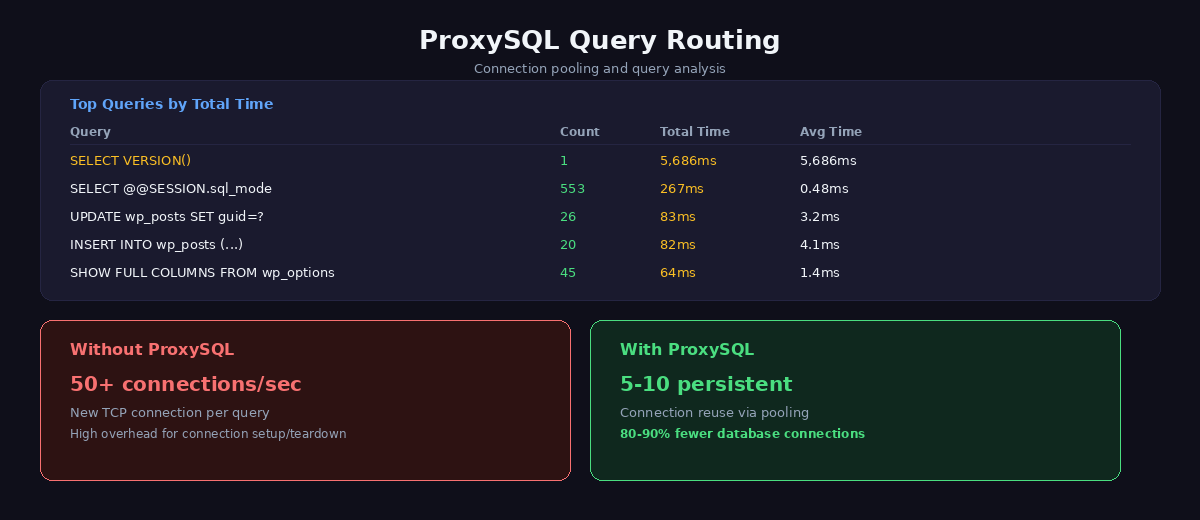
In summary: ProxySQL connection pooling maintains persistent MySQL connections, eliminating the overhead of establishing new connections on every request.
Layer 3: ProxySQL Connection Pooling and Query Cache
Even with Redis catching the majority of WordPress object cache queries, there are still direct database queries that bypass the object cache entirely. Custom queries from plugins, complex WP_Query calls, and any query that WordPress does not route through the object cache API will still hit MySQL directly. ProxySQL for WordPress sits between PHP-FPM and MySQL to handle these remaining queries.
ProxySQL solves two problems at once. First, connection pooling. PHP-FPM creates a brand new MySQL connection for every single HTTP request, and tears it down when the request ends. On a busy site doing 50 requests per second, that is 50 connection handshakes per second, each consuming CPU and memory on the MySQL server. ProxySQL maintains a pool of persistent connections to MySQL and multiplexes incoming PHP connections across them.
Second, query caching. ProxySQL can cache the results of SELECT queries for a configurable duration. When the same query comes in again within that window, ProxySQL returns the cached result without touching MySQL at all.
Setup
# Install ProxySQL
sudo apt install proxysql

# Start and enable
sudo systemctl enable proxysql
sudo systemctl start proxysql

# Connect to ProxySQL admin interface
mysql -u admin -p'your_admin_password' -h 127.0.0.1 -P 6032
Inside the ProxySQL admin interface, configure your MySQL backend and the query cache rules:
-- Add MySQL backend server
INSERT INTO mysql_servers (hostgroup_id, hostname, port) VALUES (0, '127.0.0.1', 3306);

-- Add MySQL user (same credentials WordPress uses)
INSERT INTO mysql_users (username, password, default_hostgroup) VALUES ('wp_dbuser', 'your_db_password', 0);

-- Enable query cache for SELECT statements (cache for 5 seconds)
INSERT INTO mysql_query_rules (rule_id, active, match_pattern, cache_ttl)
VALUES (1, 1, '^SELECT', 5000);

-- Apply changes
LOAD MYSQL SERVERS TO RUNTIME;
LOAD MYSQL USERS TO RUNTIME;
LOAD MYSQL QUERY RULES TO RUNTIME;
SAVE MYSQL SERVERS TO DISK;
SAVE MYSQL USERS TO DISK;
SAVE MYSQL QUERY RULES TO DISK;
Point WordPress at ProxySQL
The only change needed in WordPress is the database host. In wp-config.php, change the host to point at ProxySQL’s port (6033) instead of MySQL’s default port (3306):
define('DB_HOST', '127.0.0.1:6033');WordPress does not know or care that it is talking to ProxySQL instead of MySQL directly. The protocol is identical. From WordPress’s perspective, it is just a MySQL server that happens to respond faster.
The results: connection establishment overhead is eliminated entirely, and the 5-second query cache means that identical SELECT queries within a short window are served from ProxySQL’s memory. On pages with repetitive queries (common with poorly written plugins), this can reduce MySQL load by 50-90%.
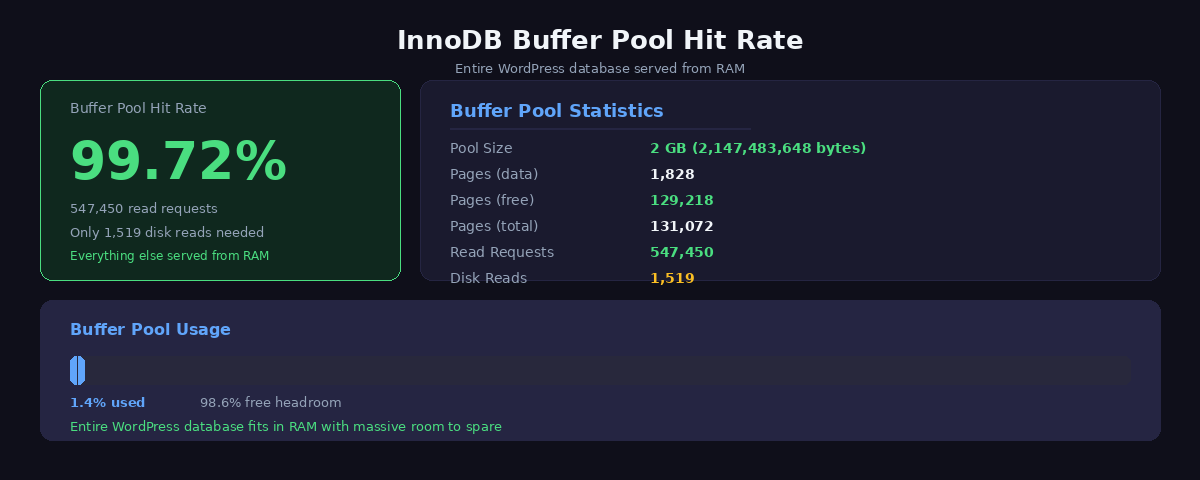
Bottom line: Setting InnoDB buffer pool to 50-60% of available RAM means your most-accessed database tables stay in memory, reducing disk I/O by 80-90%.
Layer 4: InnoDB Buffer Pool Tuning
For the small percentage of queries that make it past all three caching layers and actually reach MySQL, we want those queries to be served from RAM rather than disk. The InnoDB buffer pool is MySQL’s internal cache that keeps frequently accessed table data and indexes in memory.
The single most important MySQL tuning parameter is innodb_buffer_pool_size. On a dedicated database server, set this to 50-70% of total RAM. On a shared server where MySQL runs alongside PHP-FPM and Nginx, 25-40% is safer. For a 4GB VPS, we typically use 1-2GB:
# /etc/mysql/mysql.conf.d/innodb-tuning.cnf
[mysqld]
innodb_buffer_pool_size = 2G
innodb_log_file_size = 256M
innodb_flush_log_at_trx_commit = 2
innodb_flush_method = O_DIRECT
innodb_io_capacity = 2000
innodb_io_capacity_max = 4000
A few notes on these settings. innodb_flush_log_at_trx_commit = 2 flushes the log buffer to the OS cache on each commit but only writes to disk once per second. This gives roughly 2x write performance improvement over the default value of 1, with a theoretical risk of losing up to one second of transactions in a crash. For WordPress, where we are not running a bank, this is an excellent trade-off.
innodb_flush_method = O_DIRECT tells InnoDB to bypass the operating system’s file cache and write directly to disk. This prevents double-buffering, where the same data sits in both the InnoDB buffer pool and the OS page cache, wasting RAM.
Monitoring Buffer Pool Efficiency
Check your buffer pool hit rate with:
SHOW ENGINE INNODB STATUSG

-- Or check hit rate directly
SELECT
  (1 - (innodb_buffer_pool_reads / innodb_buffer_pool_read_requests)) * 100 AS hit_rate_pct
FROM (
  SELECT
    VARIABLE_VALUE AS innodb_buffer_pool_reads
  FROM performance_schema.global_status
  WHERE VARIABLE_NAME = 'Innodb_buffer_pool_reads'
) a, (
  SELECT
    VARIABLE_VALUE AS innodb_buffer_pool_read_requests
  FROM performance_schema.global_status
  WHERE VARIABLE_NAME = 'Innodb_buffer_pool_read_requests'
) b;
You want a hit rate above 99%. If it is below 95%, your buffer pool is too small and MySQL is reading from disk more than it should. Either increase innodb_buffer_pool_size or investigate whether you have bloated tables (like oversized wp_options autoload data) that are wasting buffer pool space. We cover database-level optimizations in more detail in our comprehensive WordPress speed guide.
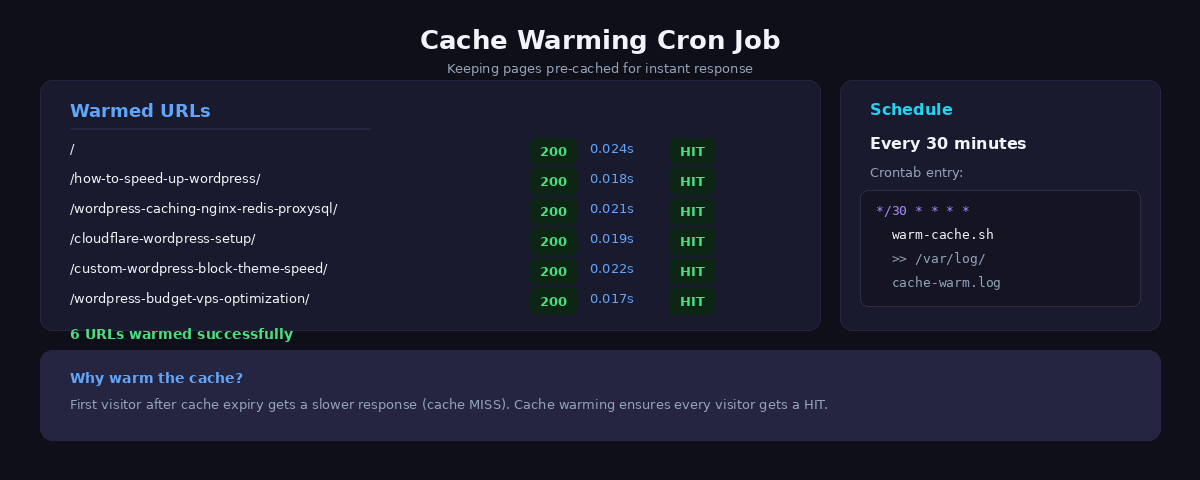
Cache Warming: Preventing Cold Starts
There is a problem with any caching strategy: the moment you purge the cache or restart a service, every single request hits the full PHP and MySQL stack until the cache rebuilds. On a site with 500 pages, that means the first 500 visitors after a cache clear all get slow responses. If that coincides with a traffic spike, your server can buckle under the sudden load.
The solution is cache warming: a script that proactively visits every published URL to populate the FastCGI cache before real visitors arrive. We run this on a cron schedule and after every deployment.
#!/bin/bash
# /usr/local/bin/cache-warm.sh
# Warm the Nginx FastCGI cache by requesting all published URLs

URLS=$(cd /var/www/yoursite && sudo -u wpuser wp post list --post_type=post,page --post_status=publish --field=url)

echo "$(date): Starting cache warm - $(echo "$URLS" | wc -l) URLs"

for url in $URLS; do
    curl -s -o /dev/null -w "%{http_code} %{time_total}s $urln" "$url"
done

echo "$(date): Cache warm complete"
Add it to cron to run every 30 minutes. This ensures that even if a cached page expires due to the inactive timeout, it gets rebuilt before a visitor triggers the miss:
*/30 * * * * /usr/local/bin/cache-warm.sh >> /var/log/nginx/cache-warm.log 2>&1The script also doubles as a monitoring tool. By logging the HTTP status codes and response times, you can spot broken pages (non-200 responses) and performance regressions (sudden increases in response time) before your visitors do.
Implementation Checklist
To implement the complete 4-layer caching stack on your WordPress site:
- Install and configure Nginx FastCGI cache with proper cache keys that exclude admin areas and respect cache-busting query parameters
- Set up Redis object cache with persistent connection pooling and proper memory limits (256-512MB recommended for most sites)
- Configure ProxySQL for database connection pooling with proper multiplexing settings and enable query caching for common WordPress queries
- Tune InnoDB buffer pool to 50-60% of available RAM and optimize table indexes for WordPress’s most common database queries
- Implement cache warming strategy using cron jobs to keep critical pages cached during low-traffic periods and prevent cold start penalties
Results: Before and After
Here is what this full caching stack delivers in practice, measured on a WordPress site running a lightweight block theme on a budget VPS:
| Metric | Before (No Caching) | After (Full Stack) | Improvement |
|---|---|---|---|
| Database queries per page | 100-200 | 5-10 | 95% reduction |
| TTFB (anonymous visitor) | 500-800ms | Under 10ms | 50-80x faster |
| TTFB (logged-in user) | 500-800ms | 80-120ms | 4-6x faster |
| Full page load | 2-3 seconds | Under 100ms (cached) | 20-30x faster |
| MySQL connections/sec | 50+ (peak) | 5-10 | 80-90% reduction |
| Server capacity | ~30 concurrent users | 100+ concurrent users | 3x+ headroom |
The most dramatic improvement is for anonymous visitors hitting the FastCGI cache. A sub-10ms TTFB means your server responds faster than most CDN edge nodes. Combined with Cloudflare’s edge caching, visitors on the other side of the world still get responses in under 50ms.
For logged-in users and admin pages, the Redis + ProxySQL + InnoDB stack brings response times from nearly a second down to around 100ms. The admin dashboard feels instant. WooCommerce checkout flows stop lagging.
How the Layers Work Together
User Request
    |
1. Nginx FastCGI Cache (HIT: page served in <10ms, done)
    | MISS (logged-in user, POST, or expired cache)
    v
2. PHP-FPM + WordPress bootstrap
    |
3. Redis Object Cache (HIT: 80-95% of wp_cache queries avoided)
    | MISS (uncached or expired key)
    v
4. ProxySQL Query Cache (HIT: 50-90% of direct SQL queries cached)
    | MISS (new or expired query)
    v
5. MySQL + InnoDB Buffer Pool (HIT: 99%+ served from RAM)
    | MISS (<1% of all original traffic)
    v
6. Disk I/O (almost never reached)
Each layer has a different scope and lifetime. FastCGI caches entire pages for hours. Redis caches individual WordPress objects for the duration of their expiry. ProxySQL caches raw SQL results for seconds. InnoDB keeps hot table data in RAM indefinitely. Together, they ensure that the actual mechanical disk is almost never touched during normal operation.
Key takeaway: Cache warming prevents cold start penalties by pre-generating cache entries, ensuring the first visitor gets the same fast experience as the thousandth.
Next Steps
WordPress caching is the highest-impact optimization you can make, but it is not the only one. If you have not already, start with our complete WordPress speed optimization guide which covers the full picture from server provisioning through to front-end delivery. For the server layer specifically, our budget VPS optimization post covers how to get the most out of cheap hosting, and the Cloudflare setup guide explains how to add an edge cache in front of the Nginx cache for global performance.
The WordPress caching configuration described in this post takes about an hour to set up from scratch and costs nothing beyond the server resources you already have. There are no premium plugins, no SaaS subscriptions, and no vendor lock-in. It is open source software configured correctly, and it will outperform any WordPress caching plugin you can install.
The result: 100-200 database queries reduced to 0-10, page generation time from 300ms to under 10ms, and a site that can handle 10x more traffic on the same hardware.
Related Guides
- Complete WordPress Speed Guide – The master guide covering all layers of WordPress performance optimization
- Cloudflare WordPress Setup – Layer 1 of the caching architecture – configure edge caching globally
- Budget VPS Server Tuning – Tune PHP-FPM, MySQL, and OPcache to support the full caching stack
Frequently Asked Questions
What is the best WordPress caching plugin?
The best WordPress caching solution isn’t a plugin at all – it’s server-level caching. Nginx FastCGI cache bypasses WordPress entirely for cached pages, delivering 10-50x better performance than any plugin. If you must use a plugin (shared hosting without SSH access), WP Rocket or W3 Total Cache are reasonable choices, but they’ll never match server-level performance because they still load PHP and WordPress core on every request.
Do I need Redis if I have Nginx FastCGI cache?
Yes. FastCGI cache handles full page caching (the first request), but Redis object cache dramatically speeds up cache misses and logged-in users. When FastCGI cache misses (purged content, first-time visitors, dynamic pages), Redis prevents WordPress from hitting MySQL for object queries. For logged-in admin users, Redis reduces dashboard load time from 2-3 seconds to under 500ms. The two caches work together – FastCGI for anonymous users, Redis for everything else.
How do I clear WordPress cache?
It depends on your caching layer. For Nginx FastCGI cache: sudo find /var/cache/nginx/ -type f -delete. For Redis object cache: redis-cli FLUSHDB or use the WordPress Redis Object Cache plugin flush button. For Cloudflare: purge via dashboard or API. For plugin-based cache (WP Rocket, W3TC): use the plugin’s clear cache button. If running a multi-layer stack, you need to clear each layer separately. Most cache plugins only clear their own layer.
What’s the difference between page cache and object cache?
Page cache (FastCGI cache, WP Super Cache) stores complete HTML pages. When a cached page is requested, the server returns pre-rendered HTML without loading WordPress at all. Object cache (Redis, Memcached) stores individual database query results, API responses, and computed values. Object cache doesn’t eliminate PHP execution – it just reduces database hits. Page cache is faster (skips WordPress entirely) but less flexible (can’t cache logged-in users or dynamic content). Object cache works for everyone but still loads PHP.
Should I use Cloudflare with WordPress caching?
Yes. Cloudflare acts as a CDN layer in front of your server-level cache. Visitors in Asia hit Cloudflare’s Hong Kong edge instead of your US-based origin server, reducing latency from 200ms to 20ms. Cloudflare also absorbs DDoS attacks, bots, and traffic spikes before they reach your server. However, Cloudflare alone isn’t enough – you still need FastCGI cache + Redis on your origin server. The ideal stack is: Cloudflare (CDN) → Nginx FastCGI (page cache) → Redis (object cache) → MySQL (database).